How wealth inequality has changed in the U.S. since the Great Recession, by race, ethnicity and income
1) Among lower- and middle-income households, white families have four times as much wealth as black families and three times as much as Hispanic families. In 2016, lower-income white households had a net worth of $22,900, compared with only $5,000 for black households and $7,900 for Hispanic households in this income tier. To some degree, this reflects differences in homeownership rates among families – 49% for lower-income whites, versus 31% for lower-income blacks and 30% for lower-income Hispanics. It is also important to note that only 25% of white households are in the lower-income tier, compared with about 50% each of black and Hispanic households. Thus, low levels of wealth are much more prevalent among black and Hispanic households than among white households.
About the same level of wealth inequality exists among middle-income households. White households in the middle-income tier had a median net worth of $154,400 in 2016, compared with $38,300 for middle-income blacks and $46,000 for middle-income Hispanics. Homeownership rates among middle-income blacks (53%) and Hispanics (60%) are also less than among middle-income whites (76%). Half of white households, 42% of black households and 40% of Hispanic households are in the middle-income tier.
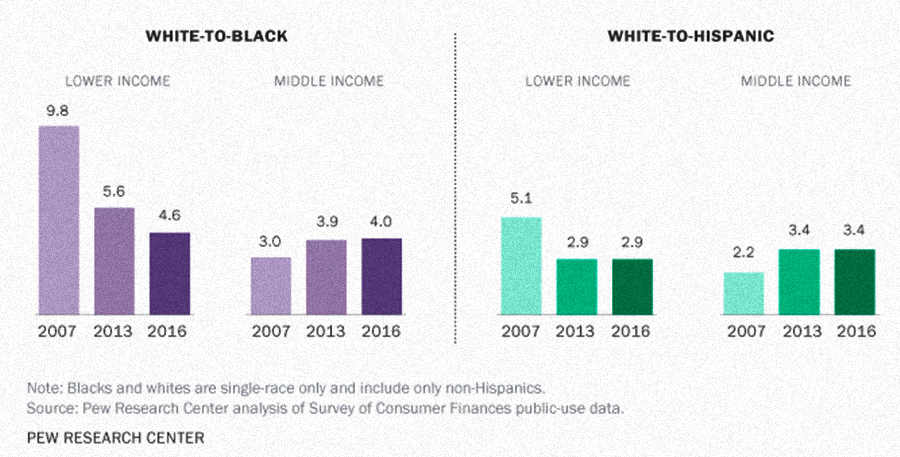
2) Lower-income white families experienced greater losses in wealth during the recession than lower-income black and Hispanic families did. Prior to the recession in 2007, lower-income white families had 10 times as much median wealth as lower-income black families – $42,700 versus $4,300 (figures in 2016 dollars). Lower-income Hispanic families had a median net worth of $8,400, lagging white families by a ratio of five-to-one.
These large wealth gaps were trimmed roughly in half by the Great Recession, which cut the median wealth of lower-income white households to $21,900 in 2010, a loss of 49%. Losses for lower-income black and Hispanic households were much smaller, 3% and 5%, respectively. The larger losses for lower-income white families may have arisen from their greater exposure to the housing market crash. In 2007, 56% of lower-income whites were homeowners, compared with 32% each of lower-income blacks and Hispanics. The homeownership rate among lower-income whites has trended downward since then, falling to 49% by 2016, but the rate for blacks and Hispanics is largely unchanged.
3) The share of lower-income white households that have no wealth or are in debt was higher in 2016 than in 2007, but the opposite is true among lower-income black and Hispanic households. A corresponding sign of recession-induced stress on household portfolios is the share of families with zero net worth or in debt. This share edged up among lower-income white families, from 14% in 2007 to 17% in 2016. Meanwhile, the share of lower-income black families with zero or negative net worth decreased from 32% to 23% and the share among lower-income Hispanic families fell from 23% to 15%. In contrast, among middle-income families, the share with zero net worth or in debt increased from 2007 to 2016, from 6% to 9% among whites, 9% to 18% among blacks, and 9% to 13% among Hispanics. Overall, black and Hispanic families are more likely than white families to have zero net worth or to be in debt.
By Rakesh Kochhar and Anthony Cilluffo